Power BI Sales Dashboard Project
Power BI Sales Dashboard Project
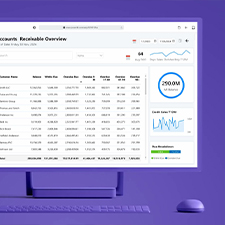
Receivable Management Dashboard
Receivable Management Dashboard using Power BI.
Financial Performance Analysis Dashboard
Visualizing financial performance: Income Statement, Cashflow, and Balance Sheet in one single power bi dashboard.

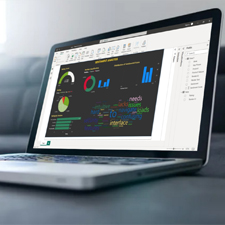
Portfolio Performance Analysis
Leveraging Power BI's robust capabilities to uncover valuable insights and make data-driven decisions in investments management.

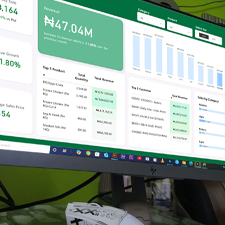
Sales KPI Dashboard
Measure Business Performance with Power BI interactive Dashboard
A NEO BANK SENTIMENT ANALYSIS
Unlocking Customers Insights for Neo Bank
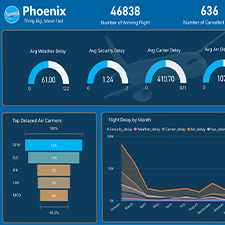
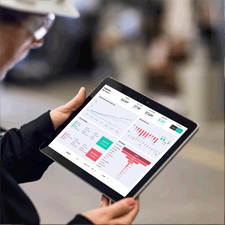
Airline Tracker
Power BI for airline tracker. Ideal dasboard is for booking larger groups of travelers and for those to understand more about the variables associated with airline travel.