Project Overview
I designed and developed a dynamic sales dashboard using Power BI to help stakeholders track revenue, analyze product performance, and gain actionable insights. This project aimed to turn raw sales data into a visually compelling and interactive report for informed decision-making.
Objective
The primary objective of this project was to create a visually appealing and user-friendly dashboard that provides a comprehensive overview of receivable aging insight; due balance, overdue aging, overdue by group, and top customers overdue balance. The dashboard aimed to empower receivable analyst, the management to make informed decisions to reduced AR days, boost revenue growth, and improve overall cash flow management.
Step 1: Data Collection and Preparation
Every successful dashboard starts with clean and structured data. I sourced sales data from multiple streams, including daily sales record, operational reports, and financial statements. Using Power Query, I performed the following tasks:
- Removed duplicates and missing values to ensure data accuracy.
- Standardized date formats and product names for consistency.
- Merged multiple data sources to create a well-structured dataset for analysis.
Step 2: Data Modeling & Relationships
To enhance efficiency and flexibility in reporting, I structured the data using a star schema:
- Fact Tables: Sales, Costs, Financials (containing transactional data).
- Dimension Tables: Products, Customers, and Dates (used for filtering and categorization).
By establishing relationships between these tables, I made it easy to slice, filter, and drill down into specific data points.
Step 3: Dashboard Design
Revenue & Sales Overview
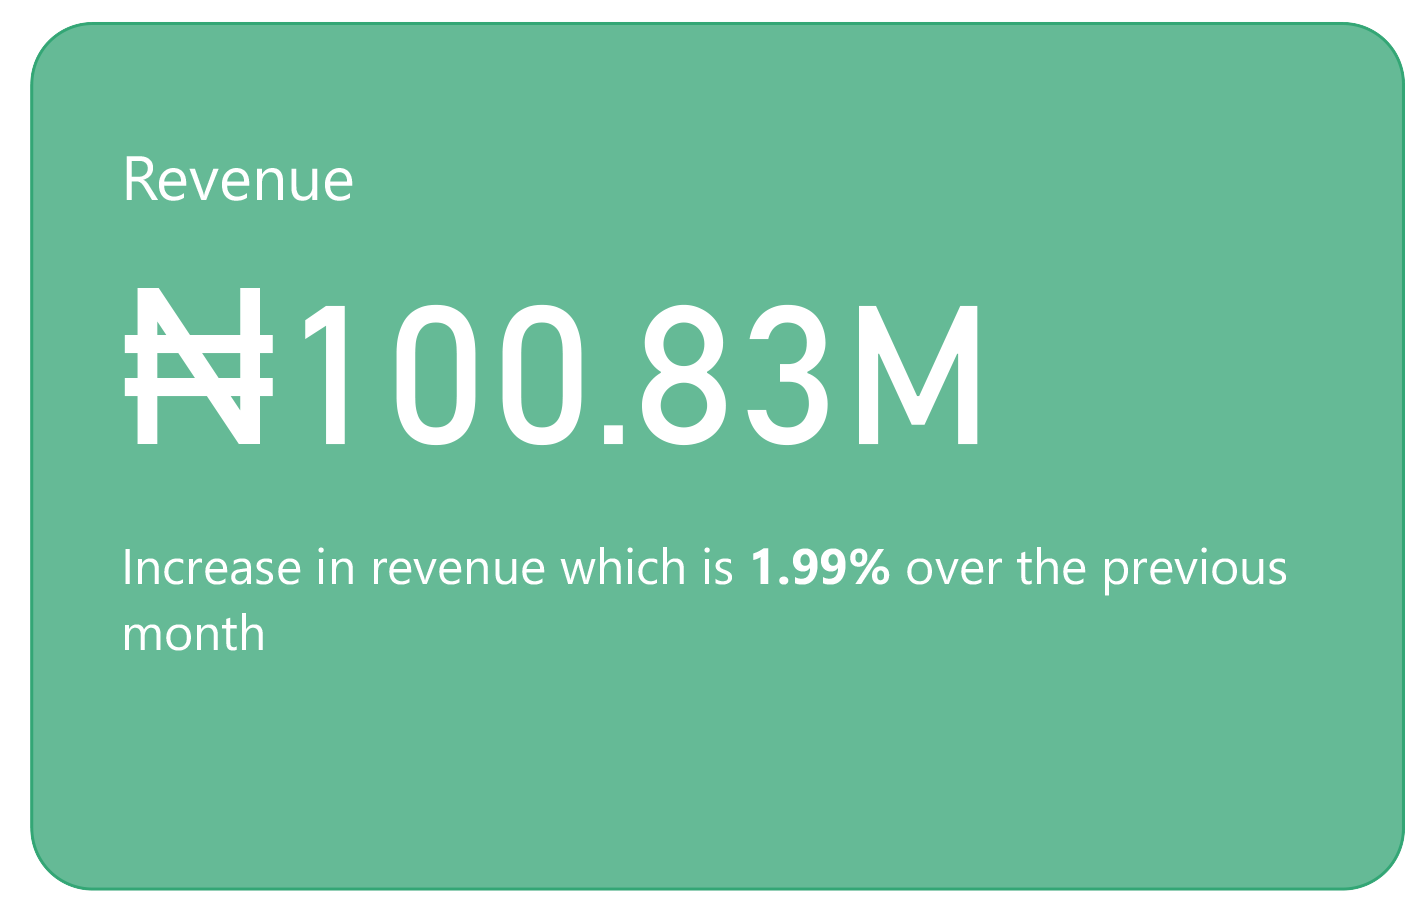
To provide a high-level performance snapshot, I incorporated:
- KPI cards displaying total revenue and growth over the previous month.
- A line chart to illustrate monthly revenue trends and seasonality.
Sales Breakdown by Category & Top Products
To highlight revenue distribution, I added:
- A card display comparing sales across key product categories.
- A bar chart to illustrate revenue by top customers.
Step 4: Enhancing Interactivity & Usability
To make the dashboard user-friendly and interactive, I incorporated:
- Slicers for filtering by year, category, and product.
- A Key Influencers Visual to identify patterns affecting sales trends.
Step 5: Publishing & Performance Optimization
After finalizing the dashboard, I published it to Power BI Service for real-time access. To ensure smooth operation:
- I set up automatic data refresh to keep reports up to date.
- Optimized performance by reducing redundant calculations and leveraging data aggregations.

Impact & Business Value
This dashboard transformed raw sales data into meaningful insights, helping stakeholders:
- Monitor revenue trends in real time and detect sales fluctuations early.
- Identify best-selling products and customer preferences for targeted marketing.
- Streamline inventory management by understanding demand patterns.
- Automate reporting, reducing the time spent on manual data processing.
Future Enhancements & Next Steps
To further improve this project, I plan to:
- Implement AI-driven forecasting models to predict future sales trends.
- Introduce customer segmentation analysis using RFM (Recency, Frequency, Monetary) modeling.
- Develop automated alerts for unusual sales trends, such as sudden spikes or declines.
Conclusion
Creating a comprehensive receivable management dashboard showcases my expertise in data analysis, visualization, and dashboard design. By following a systematic approach from generating synthetic data through ChatGPT, to data transformation and refinement, I have demonstrated my ability to transform complex data information into a user-friendly and visually appealing tool. This project exemplifies my commitment to delivering actionable insights and driving informed decision-making through data-driven solutions.