Introduction
In this article, I will outline the step-by-step process I followed to create a comprehensive financial performance dashboard. This project showcases my skills in data visualization, information design, and user experience to create an intuitive and insightful tool for financial professionals and stakeholders
Objective
The primary objective of this project was to create a visually appealing and user-friendly dashboard that provides a comprehensive overview of financial performance, key ratios, and balance sheet analysis. The dashboard aimed to empower users to make informed decisions, identify trends, and gain actionable insights by presenting complex financial data in a simplified and easily digestible format.
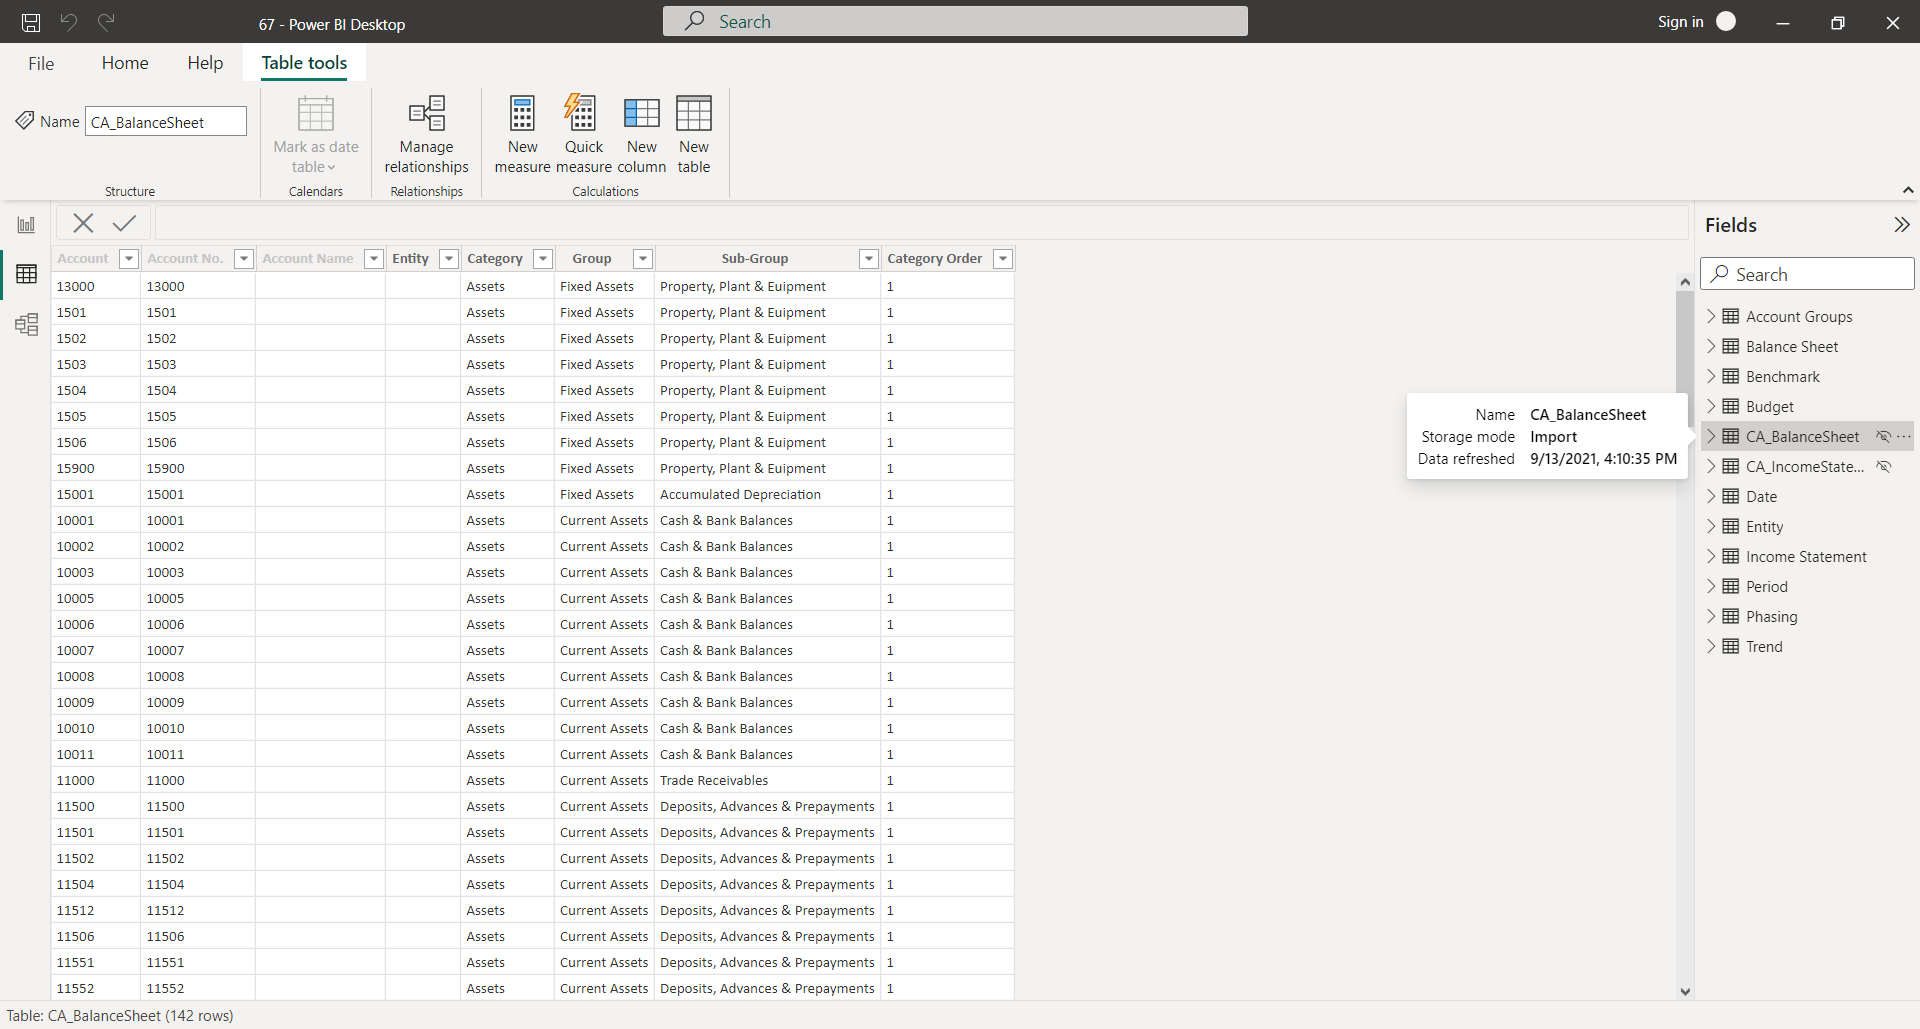
Step 1: Data Gathering and Preparation
- Extracted and transformed the data: Using Power Query in Power BI, I connected to the data sources, extracted the necessary data, and performed data transformations, such as cleaning and formatting, to ensure data accuracy.
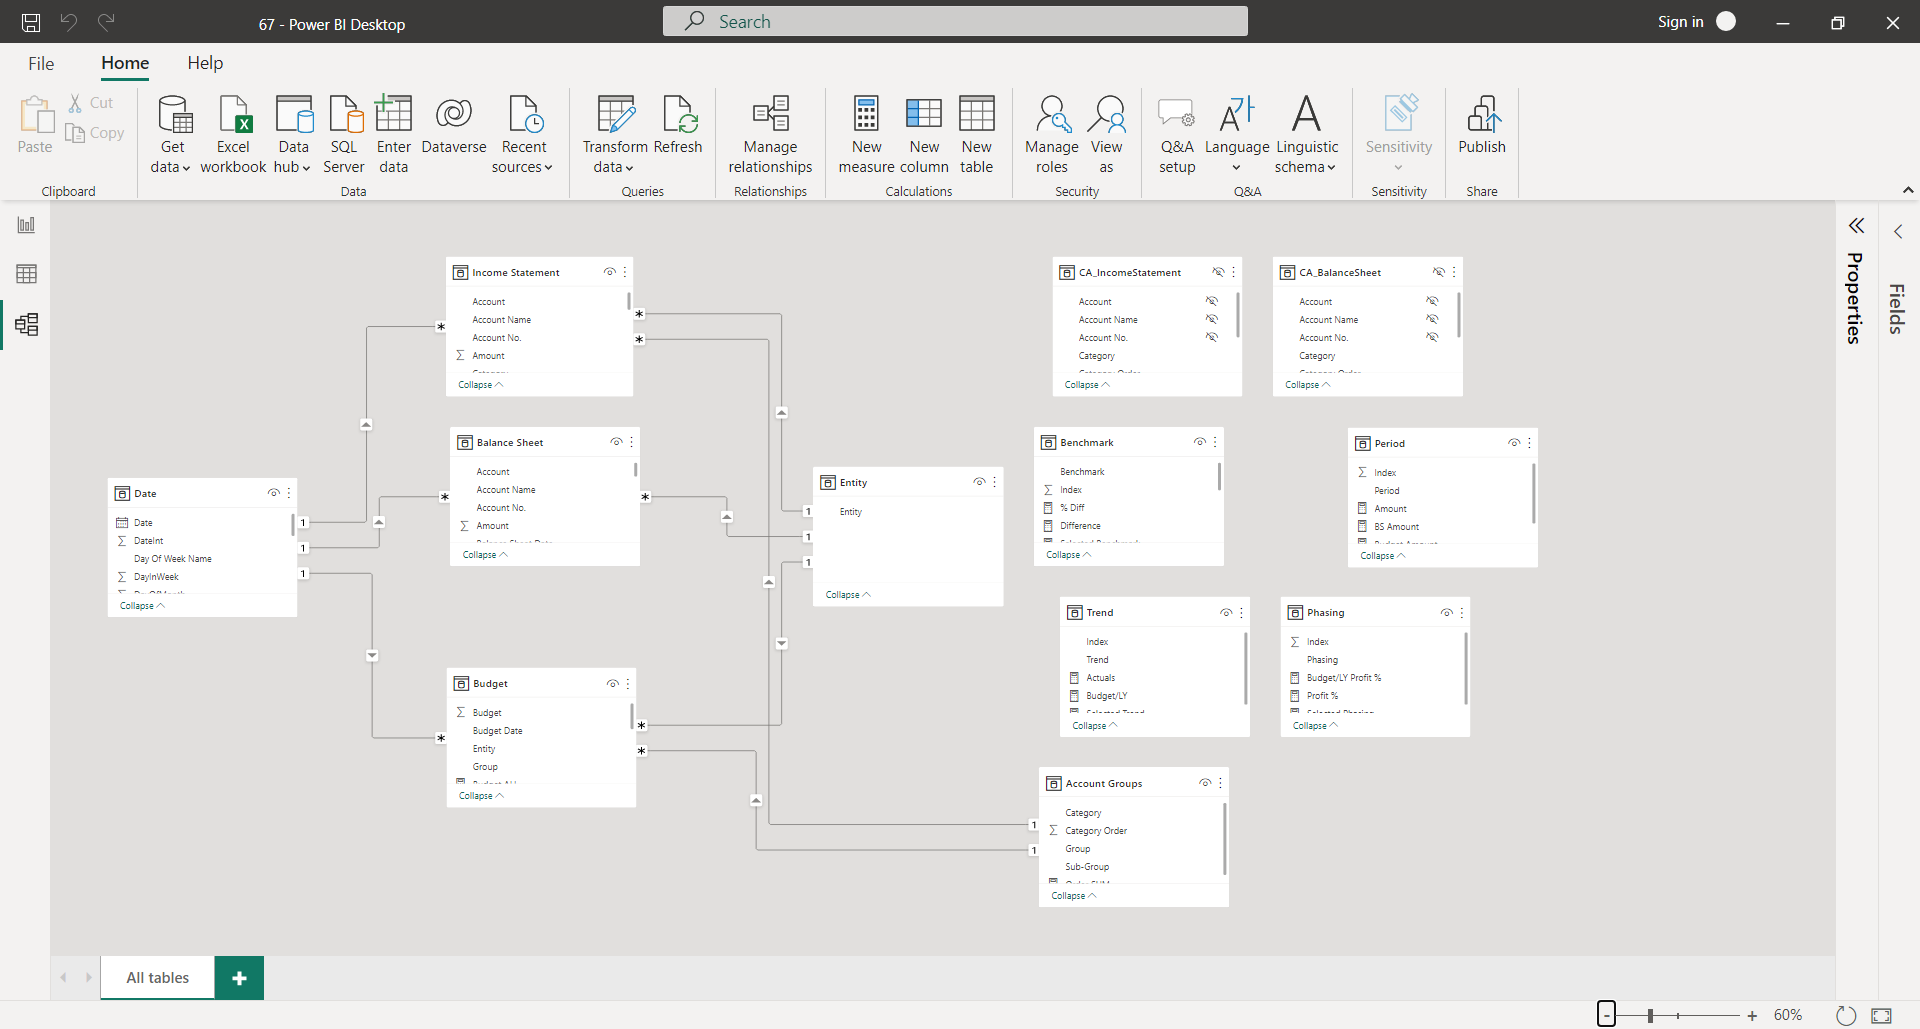
Step 2: Data Modelling
- Create a data model: Leveraging Power BI Desktop's data modeling capabilities, I established relationships between different data tables, ensuring seamless integration of the financial data.
- Defined measures and calculations: I utilized Data Analysis Expressions (DAX) to define key measures and calculations, such as revenue, expenses, profitability ratios, and balance components. This step facilitated dynamic calculations and interactivity within the dashboard.
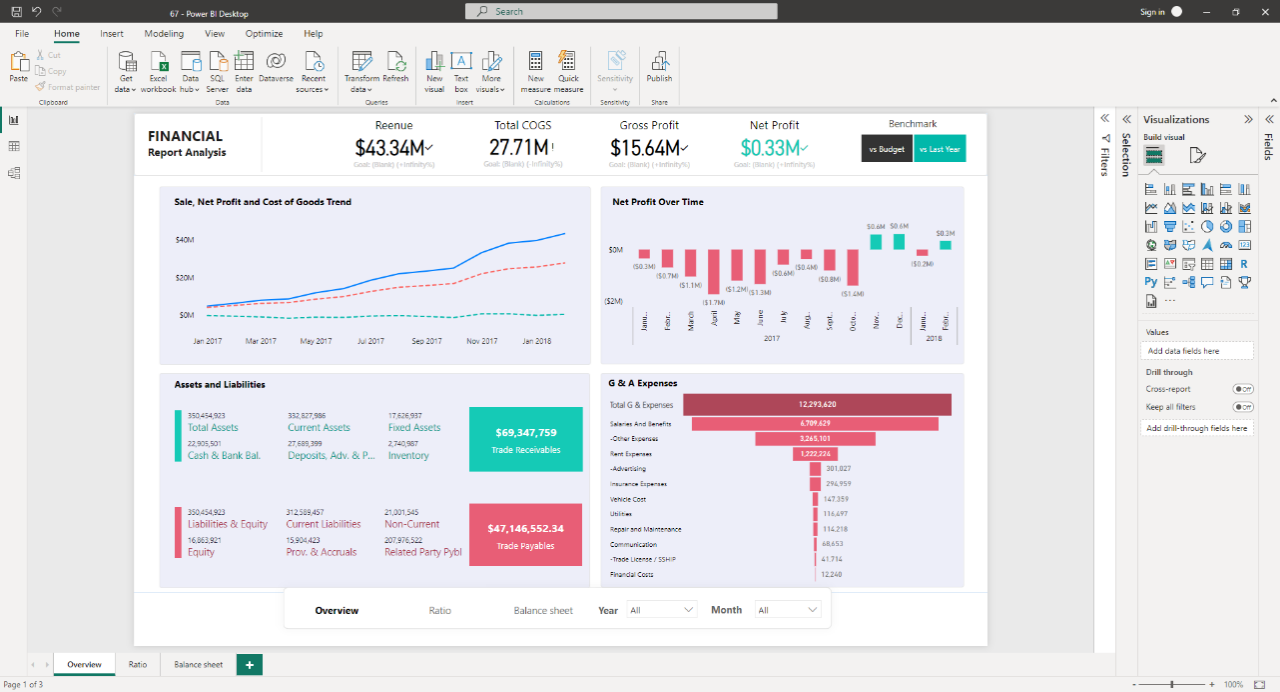
Step 3: Dashboard Design
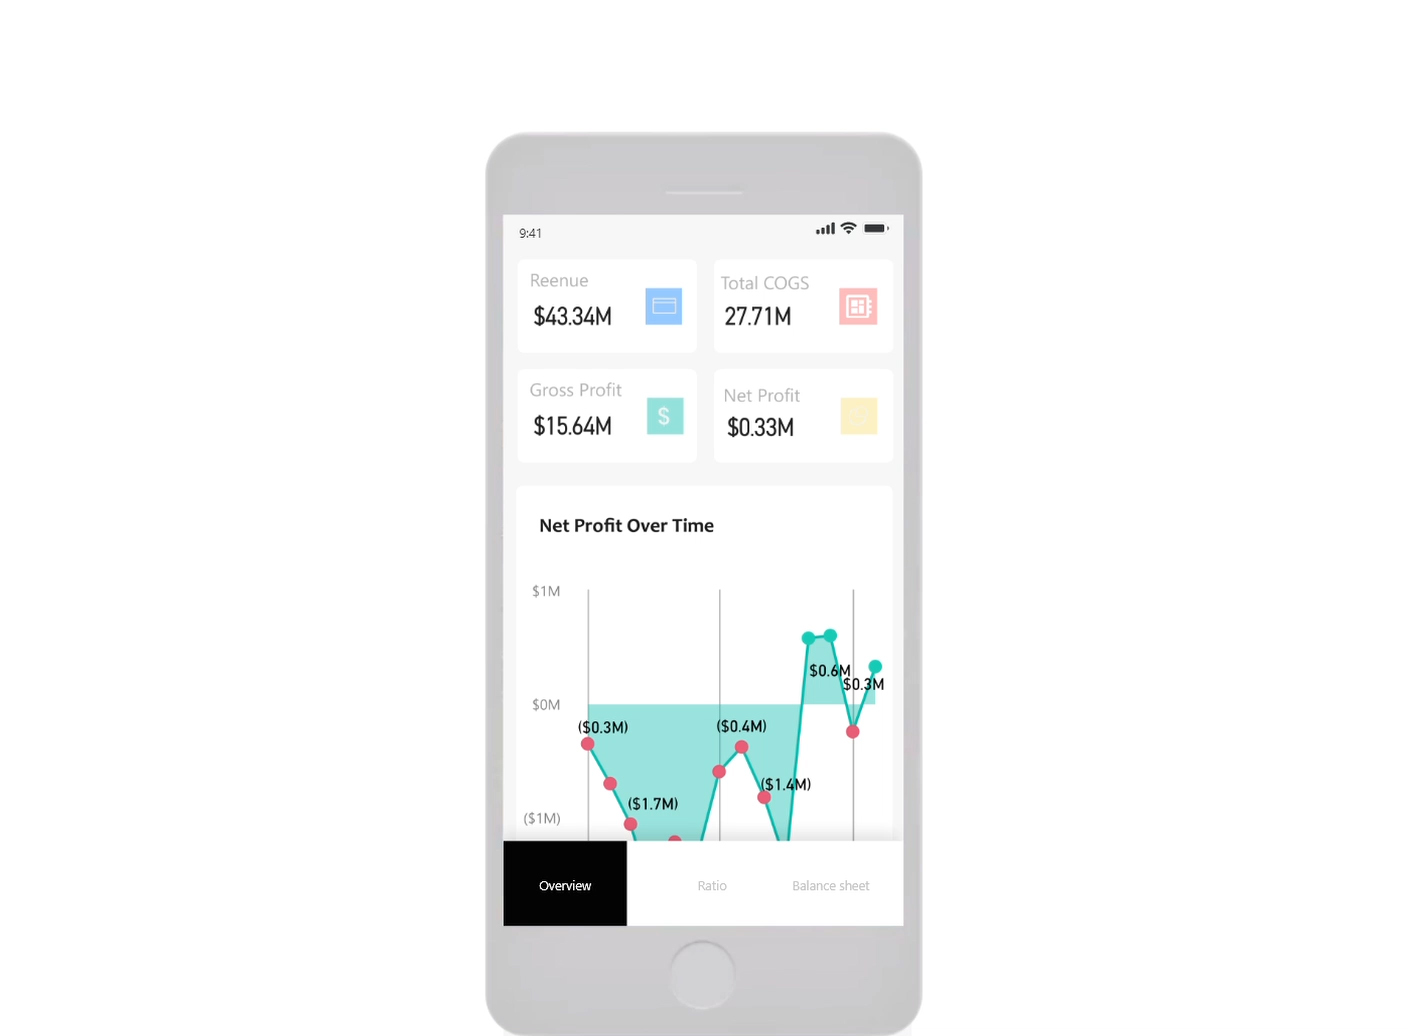
- Selected appropriate visualizations: I carefully chose the most suitable visualizations, such as charts, graphs, and tables, to effectively represent the financial data.
- Designed the layout: I created an intuitive and visually appealing layout for the dashboard, grouping related visualizations and arranging them in a logical manner to ensure easy comprehension
Step 4: Interactivity and Navigation
- Set up filters and slicers: I implemented interactive filters and slicers to enable users to slice and dice the data based on different criteria, such as time periods or departments.
- Enabled drill-through actions: By defining drill-through actions, users could access more detailed information by clicking on specific data points within the visualizations.
Step 5: Iteration and Refinement
- Ensured responsiveness and performance: I optimized the dashboard for responsiveness, ensuring it performed seamlessly across different devices and screen sizes. I also paid attention to performance optimization, minimizing loading times and enhancing overall responsiveness
Conclusion
Creating a comprehensive financial performance dashboard showcases my expertise in data analysis, visualization, and dashboard design. By following a systematic approach from data gathering to dashboard refinement, I have demonstrated my ability to transform complex financial information into a user-friendly and visually appealing tool. This project exemplifies my commitment to delivering actionable insights and driving informed decision-making through data-driven solutions.